
Get alerted on a problem
Nobody can watch a dashboard all shift. An alert rule watches it for you and speaks up when something crosses a line you set.
Before you start
Section titled “Before you start”- Data already flowing — detection set up or devices reporting telemetry
- A rough sense of what “normal” looks like for the thing you are watching
1. Look before you pick a number
Section titled “1. Look before you pick a number”Open Explore and chart the metric over the last week.
This step gets skipped and it is the reason most alerts end up muted. A threshold chosen without looking is either so tight it fires constantly or so loose it fires after the damage is done. Two minutes here saves a month of noise.
2. Create the rule
Section titled “2. Create the rule”Open Alerts and select Create Rule.
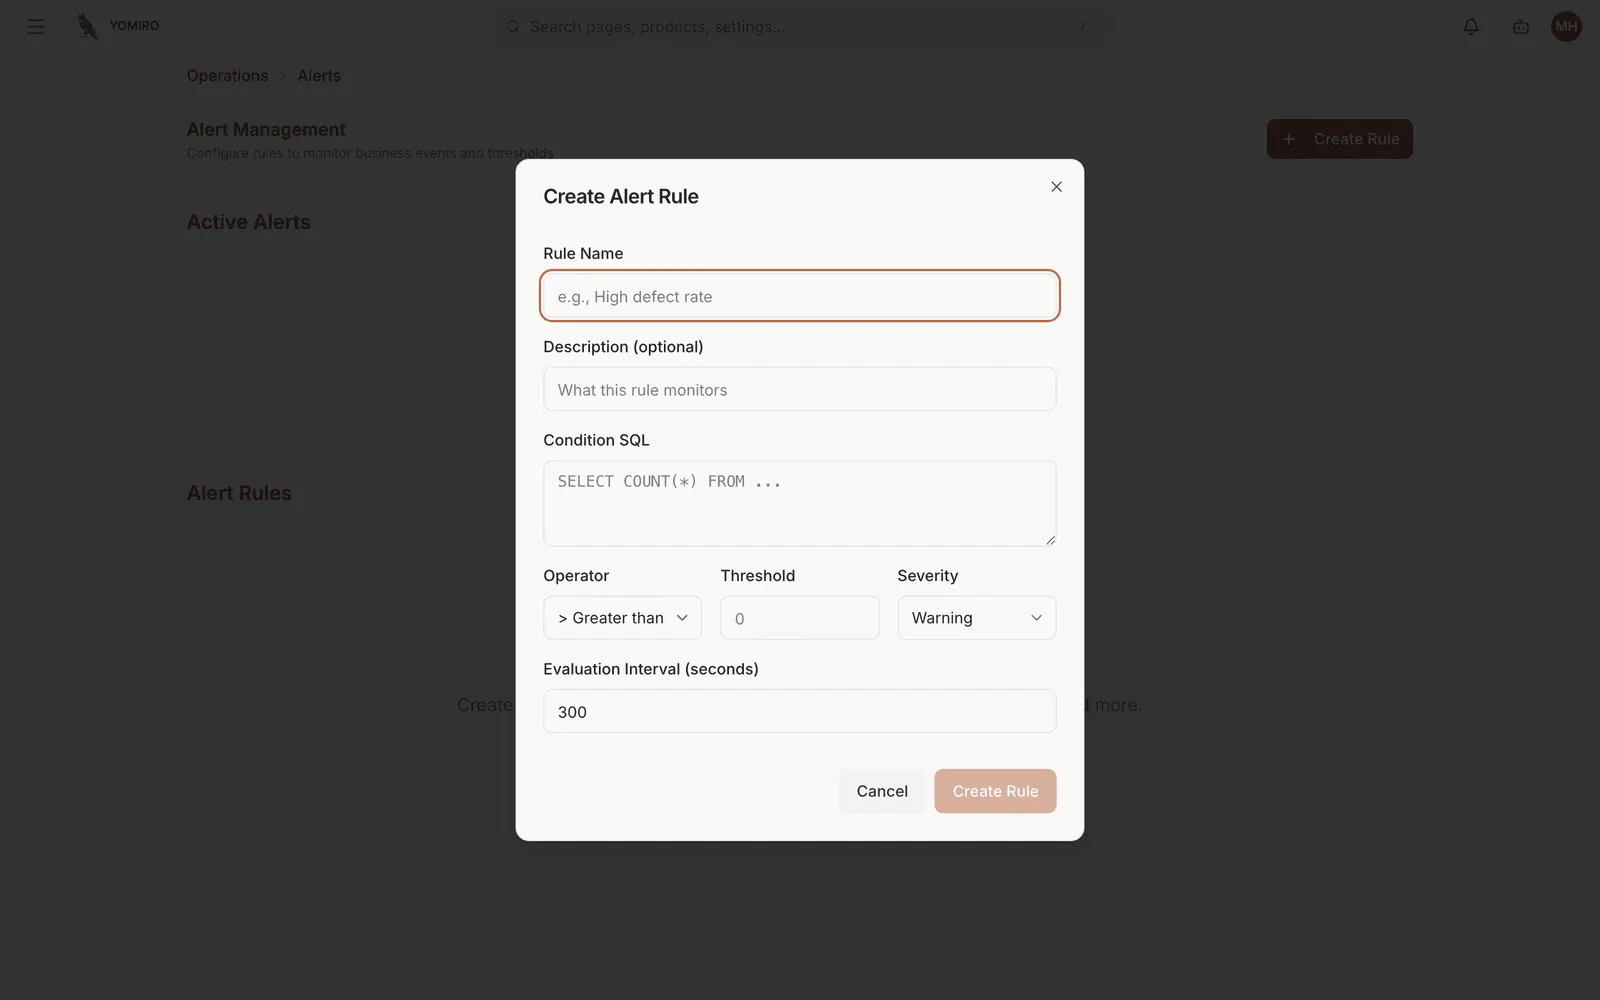
Fill in:
| Field | What to put |
|---|---|
| Rule Name | What an operator would need to read at 3am — “Defect rate above 4% on Line 3” |
| Description | Optional. Why this matters and what to do about it |
| Condition SQL | The query that produces the number to test |
| Operator | How to compare it — greater than, less than |
| Threshold | The number from step 1 |
| Severity | Info, Warning or Critical |
| Evaluation Interval | How often to check, in seconds. Defaults to 300 (five minutes) |
3. Pick the severity honestly
Section titled “3. Pick the severity honestly”| Severity | Means |
|---|---|
| Critical | Stop the line. Wake someone up |
| Warning | Deal with it this shift |
| Info | Worth recording, not worth interrupting anyone |
Severity is a promise to whoever receives it. If everything is critical then nothing is, and people stop reading.
4. Let it run, then adjust
Section titled “4. Let it run, then adjust”Rules are evaluated in the background — nobody needs a browser open.
Watch it for a shift or two. If it fires when nothing was wrong, raise the threshold or lengthen the interval. Rules can be disabled without deleting them, which is what you want during planned maintenance rather than deleting and rebuilding.
When it fires
Section titled “When it fires”The alert appears under Active Alerts. Acknowledging it marks it as seen.
If it needs actual work, raise an incident — an alert says something is wrong, an incident tracks what you did about it.
Next steps
Section titled “Next steps”- Handle an incident when a real one fires
- Alerts reference