
Inspection
Inspection answers a narrower question than Captures: does this unit match what a good one looks like? Instead of describing objects to find, you supply a reference — a golden state — and the platform reports deviations.
This is the mode for PCB assembly, kitting, and anything with a fixed expected appearance.
Profiles
Section titled “Profiles”Work is scoped by device group and then by inspection profile. The
profile picker shows entries as name (revision) — every save creates a new
revision, so a run always traces back to the exact configuration that produced
it.
If you have only one device group, the page selects it for you.
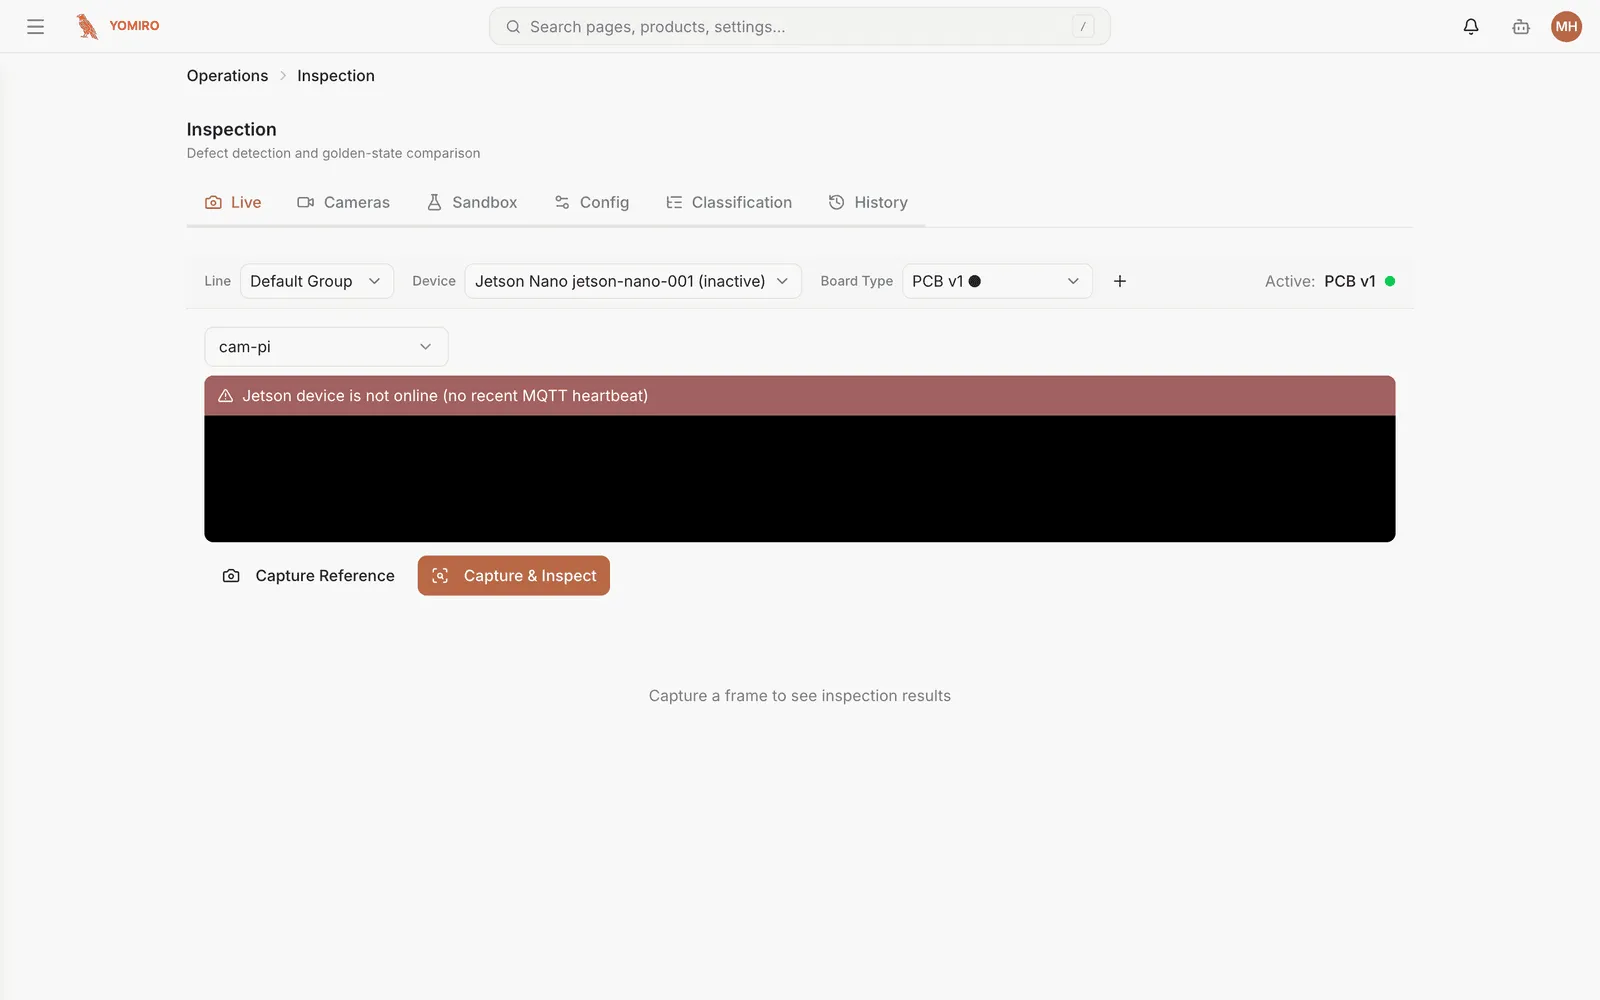
The running view: current units being inspected, with deviations from the reference highlighted as they are found.
Cameras
Section titled “Cameras”The cameras feeding inspection for this group, so you can confirm framing and lighting. Consistent framing matters more here than in Captures — the comparison assumes the unit appears where the reference says it should.
Sandbox
Section titled “Sandbox”Trial a profile without deploying it. Run it against captured media and see what it would have flagged, then adjust and run again.
Do this before every profile change that touches a live line.
Config
Section titled “Config”The profile itself: the reference images, the comparison settings, and the tolerances that decide what counts as a deviation rather than normal variation.
Saving creates a new revision instead of overwriting the old one.
Classification
Section titled “Classification”Admin only.
The schema that inspection results are sorted into — the vocabulary of outcomes, such as the defect categories a flagged unit can be assigned to. Defining it here means results stay consistent across profiles and over time, which is what makes the history worth trending.
Each schema has its own detail page for editing.
History
Section titled “History”Past inspection runs, filterable, with the result and the profile revision that produced it. This is the record you go to when someone asks what happened to a specific batch.
Annotating a capture
Section titled “Annotating a capture”Any capture from an inspection run can be opened in the annotation editor to mark up what was found — useful for correcting a misjudged deviation, and for building evidence for a supplier conversation.
Related
Section titled “Related”- Captures — open-ended detection when there is no fixed reference
- Incidents — track the response when inspection finds a real problem
- CLI › inspection-profile — manage profiles from a script