
Devices
The fleet page. Everything the platform knows comes from these devices, so this is the first place to look when data stops arriving.
The four counts
Section titled “The four counts”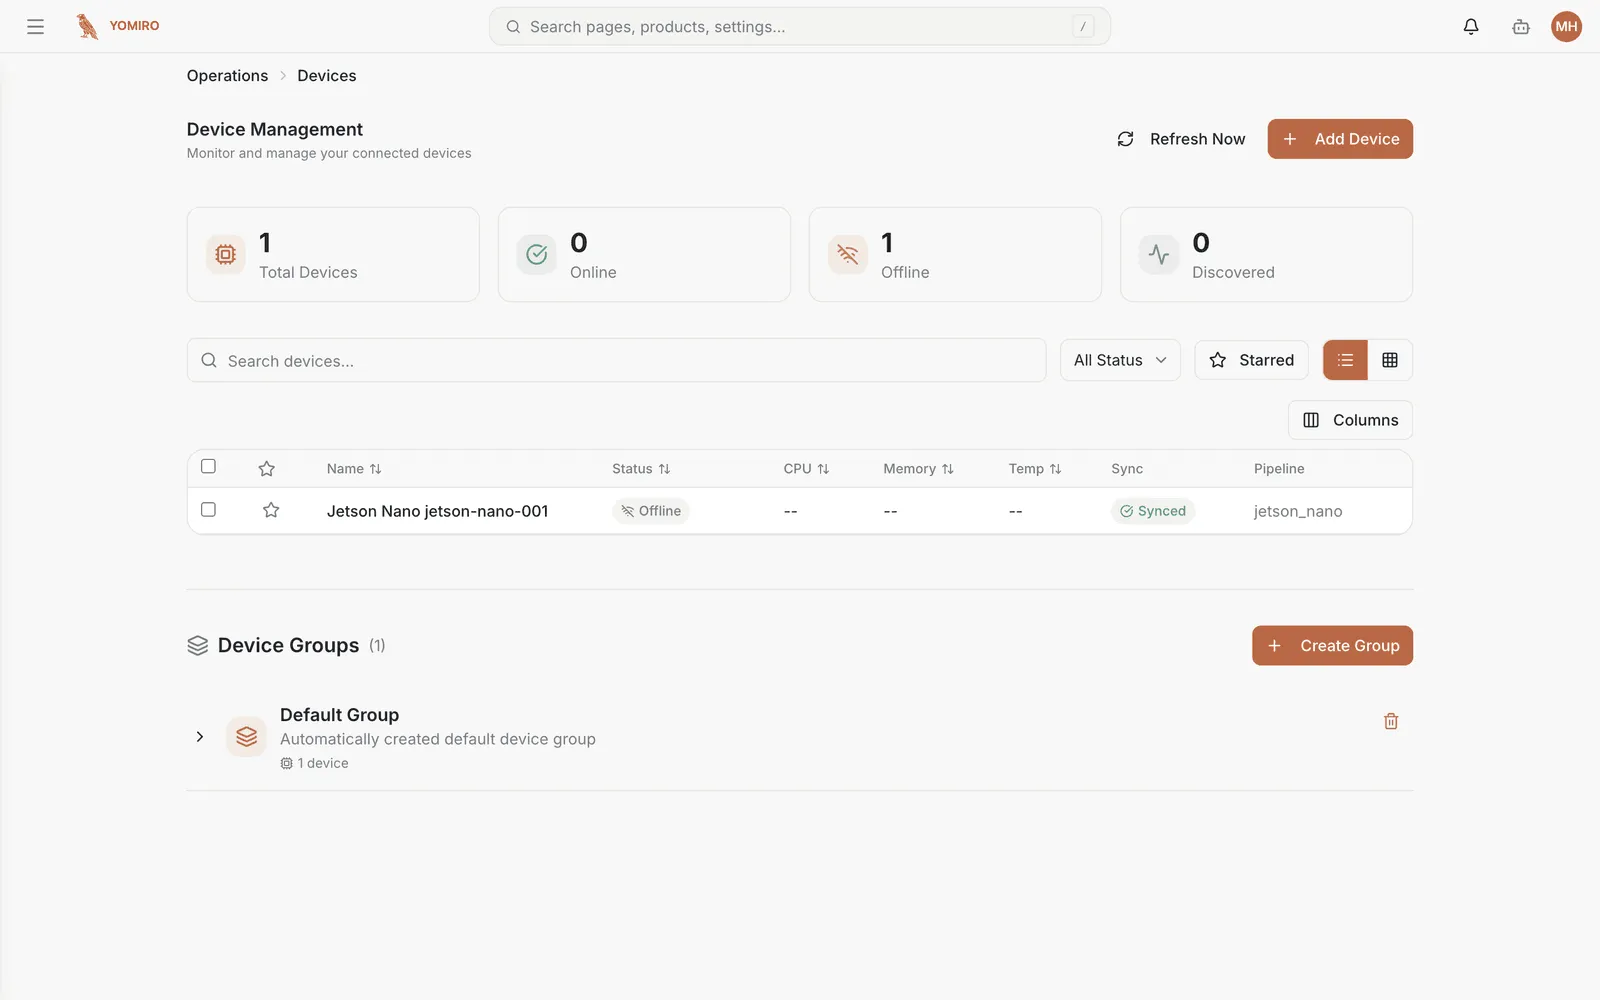
Across the top:
| Card | Meaning |
|---|---|
| Total Devices | Everything registered to your tenant |
| Online | Reporting right now |
| Offline | Registered but not reporting |
| Discovered | Announced itself, but nobody has registered it yet |
Discovered is the one people miss. A discovered device is powered on and talking, but it is not collecting anything for you until it is registered. A non-zero Discovered count is a to-do, not a status.
A rising Offline count usually means a network problem rather than several simultaneous device failures.
The device list
Section titled “The device list”Filterable by status. Each device shows its name, hardware type, online state, and its latest telemetry — CPU, memory, temperature and connectivity.
Readings of -- mean the device has not reported telemetry yet. On a
freshly-registered device that is normal for the first cycle; persisting is not.
Registering a discovered device
Section titled “Registering a discovered device”Devices announce themselves over MQTT when they come online. Open the add-device dialog to see everything discovered and not yet registered, select what you want, and register it.
If nothing appears, the device is not reaching the broker — check that it is powered on and on the right network before looking anywhere else.
Device groups
Section titled “Device groups”Groups are managed from this page, and they matter more than they look. Configuration attaches to a group, not to a device: detection settings, inspection profiles, and AI config are all set per group and delivered to every member.
A group is normally one line’s worth of cameras. Get the grouping right early — it is the unit everything else is configured against. See device groups.
Camera configuration
Section titled “Camera configuration”Which RTSP cameras a device runs, and which single one inference runs against, is configured per device from this page — open the device’s stream settings.
To watch those cameras once configured, use Captures › Cameras. A camera that is disabled here shows as disabled there.
Sending metrics elsewhere
Section titled “Sending metrics elsewhere”Device telemetry can be pushed to your own observability stack over OTLP by
configuring an ingestion endpoint. This is available through the
CLI (yomiro otel-endpoint).
Related
Section titled “Related”- Locations — where devices physically sit
- Captures — what the cameras are actually doing
- CLI › device — register and manage from a script