
Monitoring
Monitoring is where production data becomes something you can read at a glance. Build dashboards from widgets, arrange them by dragging, and keep them for the shift, the line, or the plant.
The dashboard list
Section titled “The dashboard list”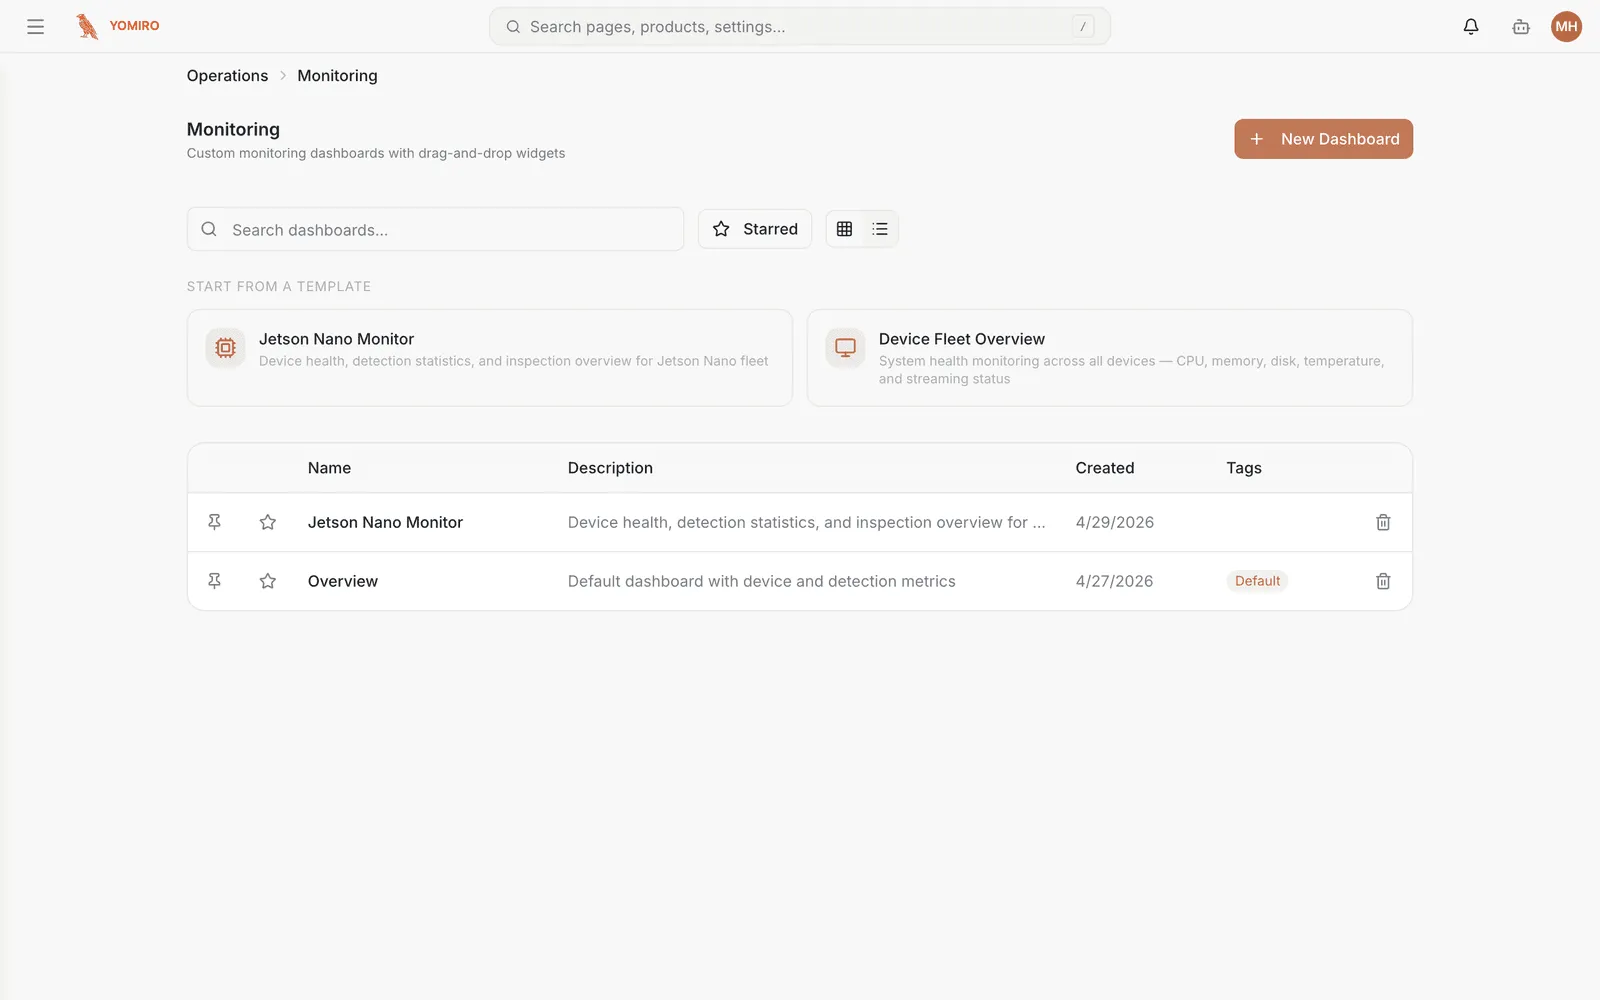
The landing page lists every dashboard in your tenant. Create a new one from here, or open an existing one.
If the list is empty, nothing has been built yet — start with a question you ask often, and use Explore to work out the query before committing it to a widget.
Building a dashboard
Section titled “Building a dashboard”Open a dashboard and add widgets. Each widget is a query plus a way of drawing it:
| Widget | Good for |
|---|---|
| Time series | Anything you want to see move — defect rate, throughput, temperature |
| Bar chart | Comparing categories — defects by type, output by line |
| Table | Detail you need to read exactly, not eyeball |
| Gauge | A single number against a target |
| Pie chart | Composition, when there are few enough slices to be legible |
Widgets are positioned by dragging and resizing. The layout is saved with the dashboard.
Dashboards are documents
Section titled “Dashboards are documents”A dashboard is stored as a structured document, not as opaque UI state. That has two practical consequences:
- You can read and edit dashboards through the
CLI (
yomiro dashboard), which makes them scriptable and reviewable. - An agent can build one for you. Describing the dashboard you want is a legitimate alternative to assembling it by hand.
Coming from Explore
Section titled “Coming from Explore”The usual workflow is not to start here. It is to ask a question in Explore, get the query right, and then send it to a dashboard — see saving a query to a dashboard.