
Dashboard
The dashboard is the landing page. It greets you by name and answers one question: is anything demanding my attention right now?
Stat cards
Section titled “Stat cards”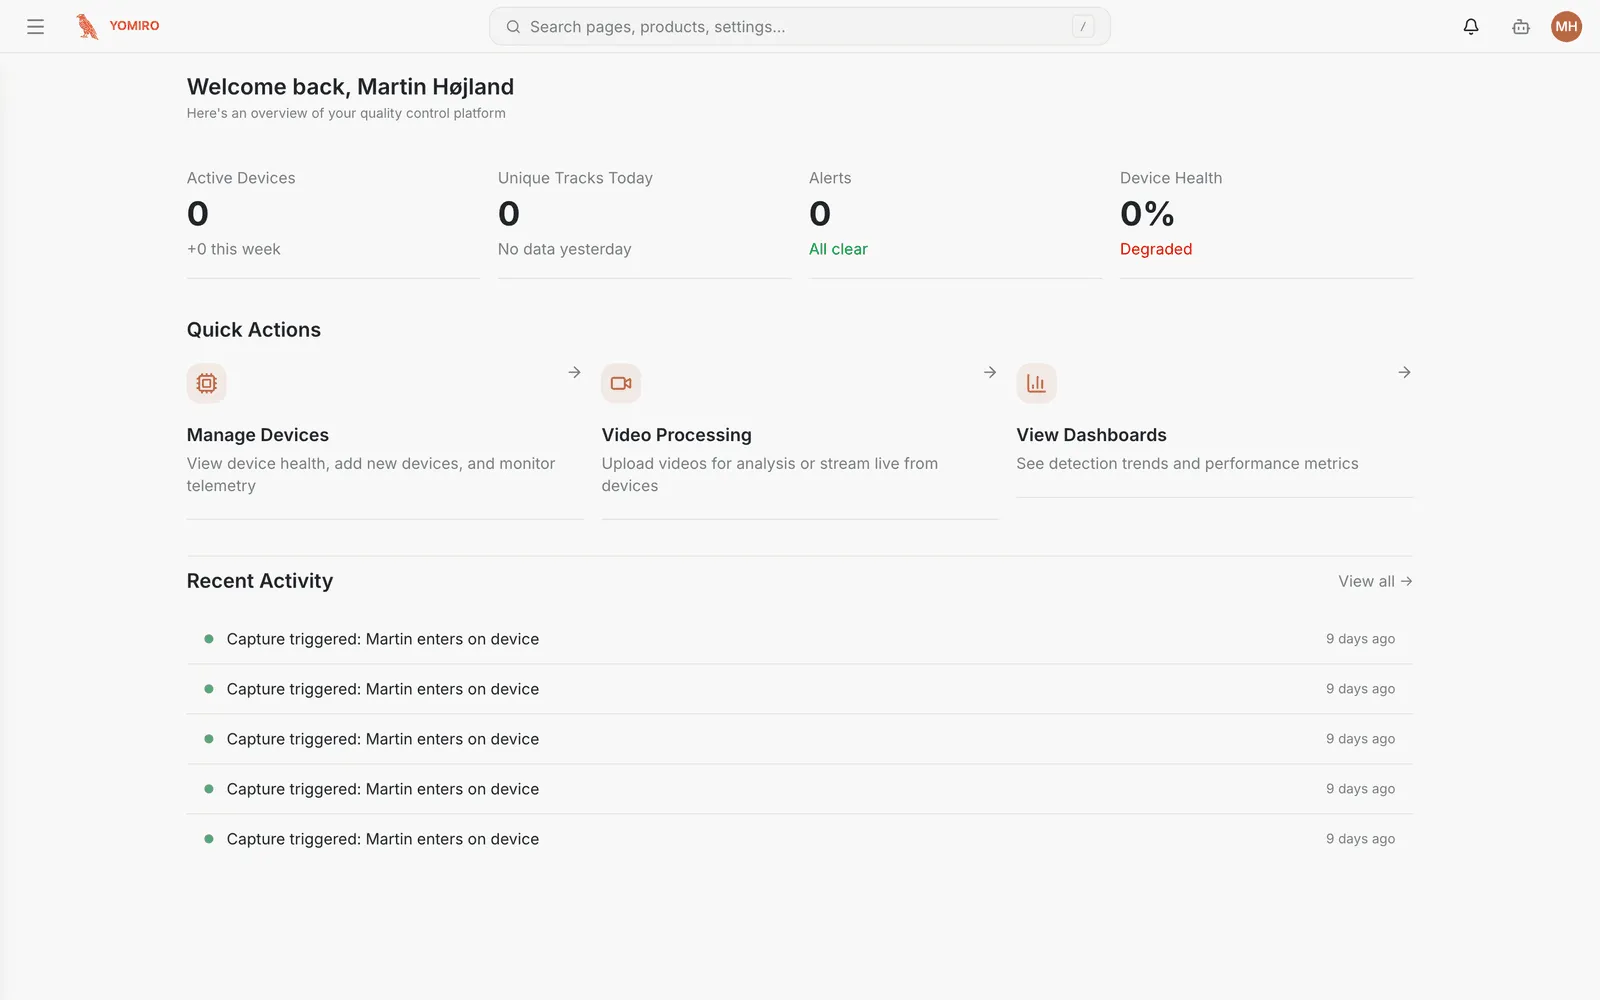
A row of cards across the top summarises the current state of the platform — device counts, recent detection volume, and similar headline numbers. The set of cards is driven by the platform rather than fixed, so it reflects what your tenant actually has configured.
Quick actions
Section titled “Quick actions”Three shortcuts into the most common starting points:
| Card | Goes to |
|---|---|
| Manage Devices | Devices — health, registration, telemetry |
| Video Processing | Captures › Live — live streams and uploads |
| View Dashboards | Monitoring — trends and performance metrics |
Recent activity
Section titled “Recent activity”A feed of what has happened lately across the tenant — registrations, config changes, detections and incident updates. View all opens Incidents.
If the feed is empty, nothing has been recorded yet; it is not an error.
What this page is not
Section titled “What this page is not”The dashboard is deliberately thin. It is a starting point, not an analytics surface — for anything you want to shape yourself, build a dashboard in Monitoring or run a query in Explore.